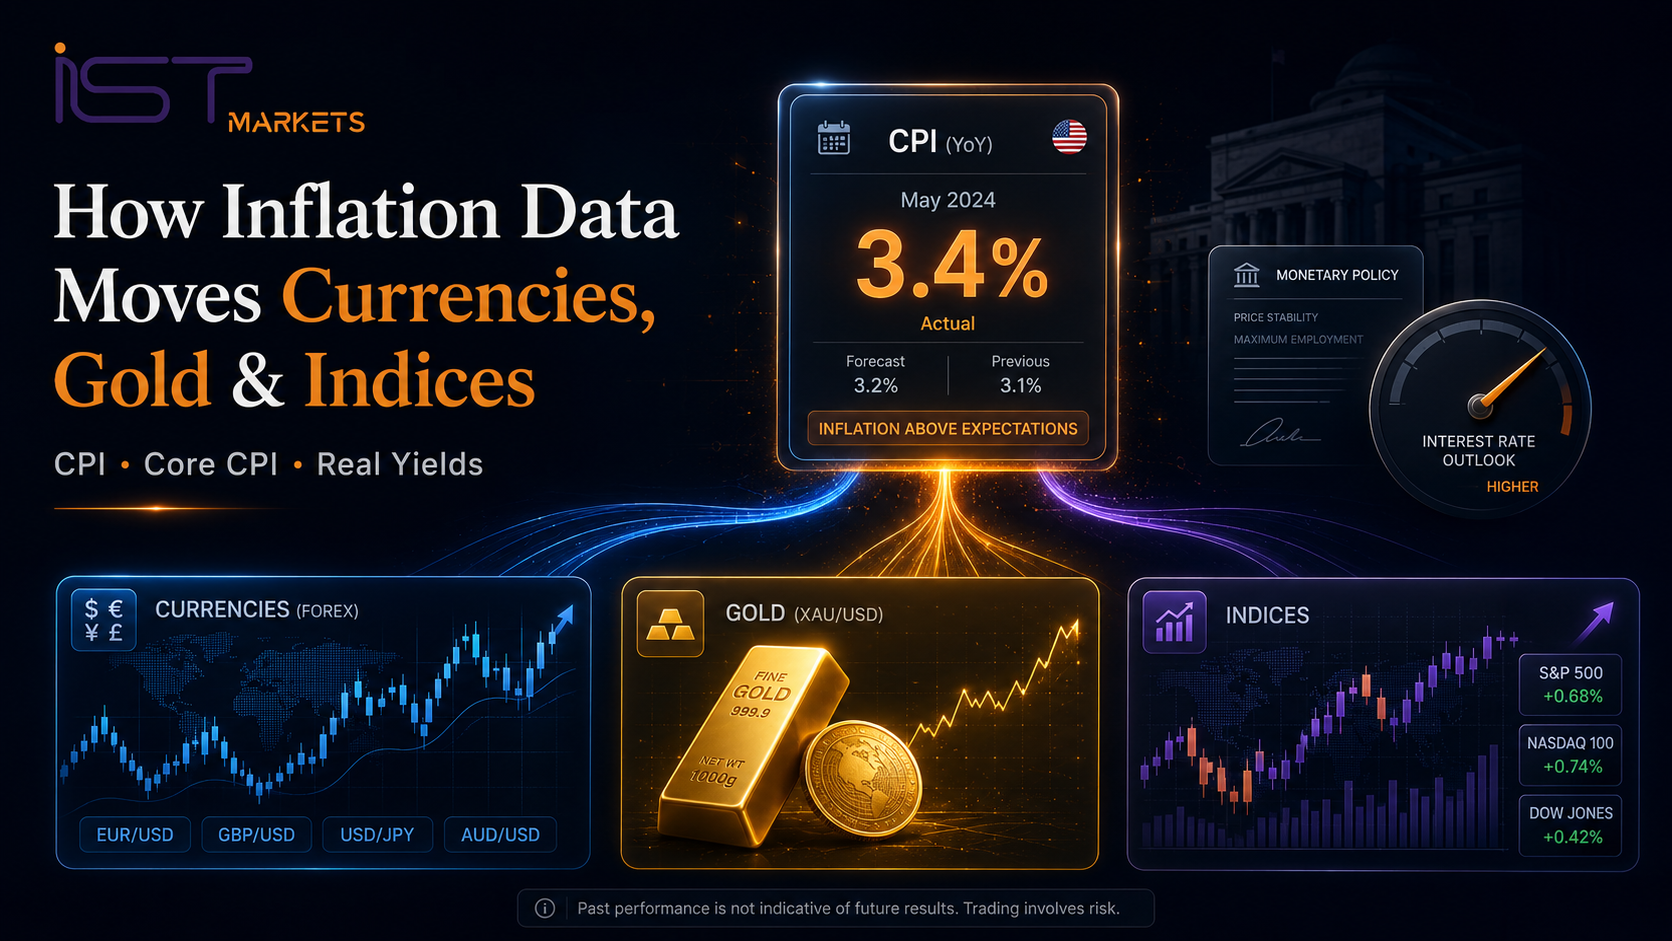
How Inflation Data Moves Currencies, Gold and Indices
A cross-market inflation data trading guide explaining how CPI, core CPI, policy expectations, real yields and the US dollar can affect forex, gold and equity indices.
Quick Answer: How does inflation data move currencies, gold and indices?
Inflation data moves markets when CPI, core CPI or another price release changes expectations for interest rates, real yields, growth and central-bank policy.
Currencies normally react through relative rate expectations, gold through competing effects from real yields, the US dollar and defensive demand, and equity indices through discount rates, company margins and growth expectations. The important factor is not whether inflation is simply high or low, but whether the release differs from what markets expected and changes the future policy outlook.
Important risk reminder
Inflation releases can create rapid volatility, wider spreads, gaps, slippage and reversals across several markets at once. A correct economic interpretation does not guarantee a profitable trade or an expected execution price. Leverage can magnify losses and margin pressure. This article is educational and does not provide personal financial advice, buy or sell recommendations, or a signal to trade an inflation release.
Source and editorial methodology
Inflation definitions and central-bank frameworks in this guide are based on official BLS, Federal Reserve, ECB, Eurostat, Bank of England and ONS sources. Gold explanations use World Gold Council research. Equity-market analysis refers to research published through the Federal Reserve’s Finance and Economics Discussion Series, which represents the authors’ research rather than an official policy position of the Federal Reserve Board. IST Markets risk, execution, fees and legal pages support the trading-risk sections.
Inflation data trading at a glance
| Market | Main transmission channel | Why the reaction can differ |
|---|---|---|
| Currencies | Relative interest-rate, yield and central-bank expectations. | The other currency, prior pricing, revisions and risk sentiment. |
| Gold | Real yields, the US dollar, inflation concern and defensive demand. | Opportunity cost, positioning and other risk drivers. |
| Equity indices | Discount rates, expected earnings, margins and growth. | Sector composition, inflation source and currency exposure. |
CPI, core CPI, PCE and HICP: what is the difference?
Inflation data measures changes in prices over time, but there is no single global inflation indicator. Different countries publish different indices, and central banks may focus on a different measure from the headline most visible on an economic calendar.
The
U.S. Bureau of Labor Statistics
describes CPI as a measure of the average change over time in prices paid by urban consumers for a basket of goods and services.
| Measure | Meaning | Why it matters | Important limitation |
|---|---|---|---|
| Headline CPI | The broad consumer basket, including food and energy. | Shows price changes across the full measured basket. | Can be affected by volatile components. |
| Core CPI | Commonly refers to all items excluding food and energy. | Provides context on underlying price pressure. | It is not the only valid inflation measure. |
| PCE inflation | A broad US measure based on personal consumption expenditures. | The Federal Reserve measures its longer-run 2% objective using PCE inflation. | CPI can still be an important market-moving release. |
| HICP | The harmonised inflation measure used in the euro area. | The ECB’s 2% medium-term target is measured using HICP. | Individual national data can differ from the aggregate. |
| UK CPI | The UK consumer-price measure published by the ONS. | The Bank of England’s inflation target is 2% CPI. | The Bank also considers wages, services and growth. |
See the official
Federal Reserve PCE explanation,
ECB monetary-policy strategy,
Eurostat HICP resources
and
Bank of England inflation guide.
What is inflation data trading?
Inflation data trading means analysing how a price release changes policy, yield and growth expectations, then assessing how currencies, gold and indices respond. It does not mean opening a position automatically because CPI was above or below a particular level.
Why this matters before funding or trading live
One inflation release can affect a currency pair, XAUUSD and an equity index simultaneously. Three instruments do not necessarily represent three independent ideas. They may all rely on the same assumption about inflation, interest rates and yields.
Before considering live exposure, a beginner should know which indicator is being released, what markets expect, how the instrument is priced, how much margin is required and whether existing positions share the same macroeconomic driver.
Use the IST guide to
using an economic calendar before trading forex, gold and indices
and check
market hours and economic events
before planning exposure.
The core principle: markets trade the inflation surprise
A high inflation rate is not automatically a market surprise. If traders expected a high number, some of its effect may already be reflected in prices. A lower number may also create little movement when it matches the forecast.
Markets respond to the difference between new information and prior expectations—not to the inflation level alone.
The IST Inflation Surprise Scorecard
| Layer | What to compare | Why it matters |
|---|---|---|
| Headline surprise | Headline actual versus forecast. | Often drives the fastest initial reaction. |
| Core surprise | Core actual versus forecast. | Can change the interpretation of underlying pressure. |
| Monthly momentum | Month-on-month readings and recent trend. | Annual inflation can stay high while recent momentum slows. |
| Revisions | Changes to previously reported readings. | Revised history can strengthen or weaken the current signal. |
| Composition | Energy, shelter, services, goods and other categories. | Broad pressure may be interpreted differently from one volatile component. |
The source of inflation also matters
- Demand-led inflation may suggest that spending remains strong enough to sustain price pressure.
- Energy-led inflation can raise prices while reducing purchasing power and growth.
- Services or wage-linked pressure may be viewed as more persistent.
- A narrow or volatile component may produce a weaker policy signal.
- A broad-based increase can carry more weight than a rise concentrated in one category.
The IST Cross-Market Inflation Decoder
The framework below moves from the official release to a risk decision without converting one data point into an automatic trade.
Which country, indicator and inflation measure are being released?
What do headline, core, monthly data and revisions say together?
Is the pressure broad, services-led, energy-led or temporary?
Did expectations for hikes, cuts or policy timing change?
What happened to nominal yields, real yields and the US dollar?
Did currencies, gold and indices support the same interpretation?
Are total exposure, spread, liquidity, leverage and margin acceptable?
For a Federal Reserve-specific explanation of policy repricing, read the IST guide to
how Fed interest-rate decisions affect forex markets.
Nominal yields, real yields and inflation compensation
Bond yields can help explain the market’s interpretation, but the statement “yields rose” is not complete enough on its own.
- Nominal yields are the quoted yields on conventional bonds.
- Real yields can be observed through inflation-protected securities such as TIPS.
- Inflation compensation, often called breakeven inflation, is derived from comparable nominal and inflation-protected yields.
The Federal Reserve publishes
TIPS yield-curve and inflation-compensation data.
Federal Reserve research also warns that inflation compensation is not a pure forecast because it can include inflation-risk and liquidity premia.
Why this distinction matters
A rise in nominal yields does not prove that real yields rose by the same amount. The move can reflect expected inflation, real-rate expectations, term premium, liquidity and bond-market conditions. Yields provide context; they are not automatic confirmation signals.
How inflation data moves currencies
Inflation data moves currencies mainly when it changes the expected relative policy path between two economies.
Hotter-than-expected inflation may support a currency when markets price higher rates, fewer cuts or a longer restrictive period. Softer inflation may weaken it when markets price earlier easing.
The effect remains relative. EUR/USD compares Federal Reserve expectations with ECB expectations. GBP/USD also depends on the Bank of England, while USD/JPY can be influenced by Bank of Japan policy, Japanese yields and global risk demand.
| Inflation outcome | Possible policy interpretation | Why the currency reaction may differ |
|---|---|---|
| Headline and core above forecast | More restrictive expectations may emerge. | The surprise may already be priced or the other bank may be more hawkish. |
| Headline high, core softer | The inflation signal is mixed. | The first currency move may fade. |
| Headline and core below forecast | Earlier or faster easing may be considered. | Growth fear or defensive demand may still support the currency. |
For a currency-focused process, continue with the IST guide to
how CPI and core CPI move forex markets.
How inflation data moves gold
Inflation data moves gold through competing forces: inflation concern and defensive demand on one side, and real yields, the US dollar and opportunity cost on the other.
Gold is often described as an inflation hedge, but that does not mean it must rise after every hot CPI report. World Gold Council research finds that changes in US CPI have historically had a weak linear relationship with gold returns. Dollar movement, real yields, policy expectations, risk and investment demand can offset or dominate the inflation effect.
Inflation and uncertainty channel
Gold may receive support when inflation increases concerns about purchasing power, policy credibility or financial uncertainty.
Opportunity-cost channel
Gold may face pressure when real yields and the US dollar rise, increasing the opportunity cost of holding a non-yielding asset.
See the
World Gold Council research on gold and inflation
and its
2026 discussion of interest rates, real yields and gold.
Gold does not trade inflation alone. It trades the market’s response through real yields, the US dollar, policy expectations, uncertainty and positioning.
Continue with
gold trading for beginners
and the IST comparison of
gold versus forex trading.
How inflation data moves equity indices
Inflation data moves equity indices by changing discount rates, expected company margins, economic-growth expectations and sector-level performance.
Research published in the Federal Reserve’s Finance and Economics Discussion Series found that investors have often interpreted higher-than-expected inflation as stagflationary: expected nominal cash flows remained weak while discount rates increased, contributing to lower stock prices. The findings represent the authors’ research and not an official policy position of the Federal Reserve Board.
Another FEDS study shows that inflation sensitivity can change with the economic environment. Inflation associated with stronger real growth may be interpreted differently from inflation viewed as a negative cost shock.
| Index characteristic | Potential sensitivity | Why the reaction can differ |
|---|---|---|
| Growth-heavy | May be more sensitive to higher discount rates. | More of the valuation may depend on future earnings. |
| Broad-market | Balances growth, value, financial and defensive sectors. | Sector reactions may offset each other. |
| Bank-heavy | May react to rates, yield curves and credit conditions. | Higher rates can support income but increase credit risk. |
| Commodity-heavy | May respond differently to energy-led inflation. | Commodity producers and consumers experience different effects. |
| Export-heavy | Can be affected by the related currency move. | Currency strength can alter overseas revenue translation. |
Read the FEDS research on
stagflationary stock returns
and
good and bad inflation.
Cross-market inflation reaction matrix
| Inflation result | Possible rate interpretation | Currency channel | Gold channel | Index channel | What may change the interpretation? |
|---|---|---|---|---|---|
| Headline and core hot | More restrictive pricing may emerge. | Relative support may appear if yields rise. | Pressure is possible if real yields and USD rise. | Discount-rate pressure may increase. | Prior pricing, weak composition or falling yields. |
| Headline hot, core softer | The policy signal may be mixed. | The first move may fade. | Yields and the inflation source become important. | Sector divergence may appear. | Core, revisions or energy details dominate. |
| Headline soft, core sticky | Initial easing expectations may reverse. | An early decline may be retraced. | An early rise may fade if yields rebound. | Initial equity relief may weaken. | Sticky services or underlying pressure. |
| Headline and core soft | Easier policy may be priced. | Relative currency pressure is possible. | May benefit if real yields and USD fall. | May receive relief if growth fears remain contained. | A weak growth signal or risk-off move. |
| Energy-driven hot CPI | Stagflation concerns may increase. | Exporter and importer currencies may diverge. | Inflation demand and yield pressure may conflict. | Energy-heavy and growth-heavy indices may diverge. | The bank may look through a temporary shock. |
How to use the matrix
These are interpretation pathways, not predicted outcomes. Positioning, growth expectations, liquidity, the other economy and separate market events can produce a different reaction.
Why the first inflation reaction can reverse
| Phase | What may drive it | Beginner caution |
|---|---|---|
| Initial headline | Actual versus forecast, algorithms, stops and thin liquidity. | The fastest move may not reflect the full report. |
| Detail reading | Core, monthly data, revisions and components. | The headline interpretation may weaken. |
| Rates repricing | Policy expectations, nominal yields and real yields. | The dollar and gold may reverse if yields change direction. |
| Cross-market assessment | Currencies, gold, indices and sector divergence. | Different markets may reveal conflicting interpretations. |
Practical scenario: one CPI opinion, three correlated trades
Scenario note
This example is hypothetical. It does not describe a current event or recommend any position.
A beginner expects US CPI to be hotter than forecast and prepares three positions: one expecting dollar strength, one expecting gold weakness and one expecting a growth-heavy equity index to fall.
The instruments look different, but all three depend on almost the same thesis:
Hot CPI → higher expected rates → higher yields → stronger dollar → weaker gold and growth stocks
Headline CPI arrives above forecast, but core CPI is softer. Yields rise immediately and then reverse. The dollar loses part of its gain, gold rebounds and the index recovers. Spreads were wider during the first move, and the total potential loss across the positions exceeded the trader’s intended risk.
| What went wrong? | Better process |
|---|---|
| Headline CPI was read in isolation. | Read headline, core, momentum and revisions together. |
| The first yield move was treated as permanent. | Check whether the yield reaction is sustained. |
| Three instruments were treated as separate ideas. | Calculate risk across the shared thesis. |
| Spread and slippage were ignored. | Assess execution conditions before acting. |
The central lesson
Diversifying instruments does not necessarily diversify the underlying economic thesis. Several positions can become one concentrated inflation bet.
Costs, execution risks and account limitations
| Risk | Examples | Preparation response |
|---|---|---|
| Interpretation | Ignoring forecasts, core data, revisions or composition. | Use the complete surprise scorecard. |
| Correlation | Several positions rely on the same rate and yield assumption. | Treat the positions as one risk budget where appropriate. |
| Execution | Wider spreads, gaps, slippage, rejections or delayed fills. | Accept that the requested price may not be available. |
| Leverage and margin | Several simultaneous moves can reduce free margin quickly. | Calculate total exposure and reduce size where necessary. |
| Trading costs | Spread, commission, swap and currency conversion. | Check the live instrument and account specifications. |
The IST Markets
Order Execution Policy
explains how orders can be affected by available prices, volatility, liquidity and slippage. The
Risk Disclosure
covers leveraged trading, margin, gaps, illiquidity and stop-loss limitations.
Review
trading fees, spreads and overnight costs
and the
legal documents applicable to the account
rather than assuming currencies, gold and indices use identical cost or contract structures.
Common inflation data trading mistakes
| Mistake | Why it is weak | Better routine |
|---|---|---|
| Trading the inflation level instead of the surprise | The level may already be reflected in prices. | Compare actual, forecast and previous readings. |
| Reading headline CPI alone | Core, revisions and components may tell a different story. | Use the full scorecard. |
| Assuming inflation always lifts gold | Real yields or the US dollar may dominate. | Assess both inflation demand and opportunity cost. |
| Treating all indices alike | Sector and currency exposures differ. | Check the index composition and inflation source. |
| Chasing the first candle | The first move may reflect algorithms and limited liquidity. | Read the report and repricing before reassessing. |
| Ignoring correlated exposure | Several positions can lose together. | Calculate total risk across the shared thesis. |
Inflation data trading checklist
Before the release
After the release
When waiting or skipping may be more appropriate
- Headline and core readings send conflicting messages.
- Previous readings receive large revisions.
- Yields and the dollar reject the initial interpretation.
- Another event is driving gold or indices.
- Spread, slippage or liquidity exceed the risk plan.
- Price has moved beyond the original setup.
- The account already contains correlated exposure.
- Contract size or margin impact remains unclear.
Risk reminder before taking action
Even when the inflation report is interpreted correctly, markets may respond differently from previous events. Orders can be filled at a different price during gaps or fast conditions, and correlated positions can magnify losses. Review the
IST Markets Risk Disclosure
and
Order Execution Policy
before trading leveraged products.
Practise reading the full inflation reaction first
Start with the
economic-calendar preparation guide.
Continue through the
Macro & Fundamental Analysis hub,
risk-management guides
and
platform and tools education
before considering live exposure.
A demo environment can support workflow practice, but it cannot prove future live spreads, fills, slippage, emotions or results.
Final takeaway
Inflation data does not move currencies, gold and indices through one universal rule. The stronger process is to identify the release, measure the surprise, understand its composition, assess policy and yield repricing, compare the cross-market reaction and then filter the idea through exposure and execution risk.
Frequently Asked Questions
What is inflation data trading?
Inflation data trading means analysing how releases such as CPI and core CPI change expectations for interest rates, yields, currencies, gold and equity indices. It is an event-risk process, not an automatic direction signal.
How does CPI affect currencies, gold and stock indices?
CPI can affect currencies through relative policy expectations, gold through real yields and the US dollar, and indices through discount rates, margins and growth expectations. The reaction depends on the surprise, composition and prior pricing.
What is the difference between headline CPI and core CPI?
Headline CPI includes the broad consumer basket, including food and energy. Core CPI commonly refers to all items excluding food and energy. Both should be read together rather than treated as competing measures.
Why can gold fall when inflation is higher than expected?
Gold can fall when hotter inflation causes real yields and the US dollar to rise, increasing the opportunity cost of holding gold. Inflation concern may support gold, but it competes with yield, dollar and positioning effects.
Why can stock indices rise after a hot CPI report?
An index may rise when the result was already priced in, core details were softer, yields reversed, growth remained resilient or the inflation source benefited heavily weighted sectors.
What should beginners check before trading inflation data?
Check the release time, headline and core forecasts, previous values, central-bank expectations, yields, affected markets, correlated exposure, contract size, spread, leverage, margin and order settings.
What are the main risks of inflation data trading?
Risks include misreading the report, correlated exposure, rapid reversals, wider spreads, slippage, gaps, stop-price uncertainty, excessive leverage and margin pressure.
References and Further Reading
- BLS — Consumer Price Index
- Federal Reserve — Inflation and PCE
- ECB — Monetary Policy Strategy
- Eurostat — HICP
- Bank of England — Inflation and the 2% Target
- World Gold Council — Gold as a Strategic Inflation Hedge
- Federal Reserve — TIPS and Inflation Compensation
- FEDS — Stagflationary Stock Returns
- IST Markets — Risk Disclosure
- IST Markets — Order Execution Policy
How this article is maintained
This guide should be reviewed when official inflation methodologies, central-bank frameworks, IST risk documents, fees, account terms or execution policies change materially. Current inflation figures, forecasts, yields and market-implied expectations should always be checked against the latest official release.