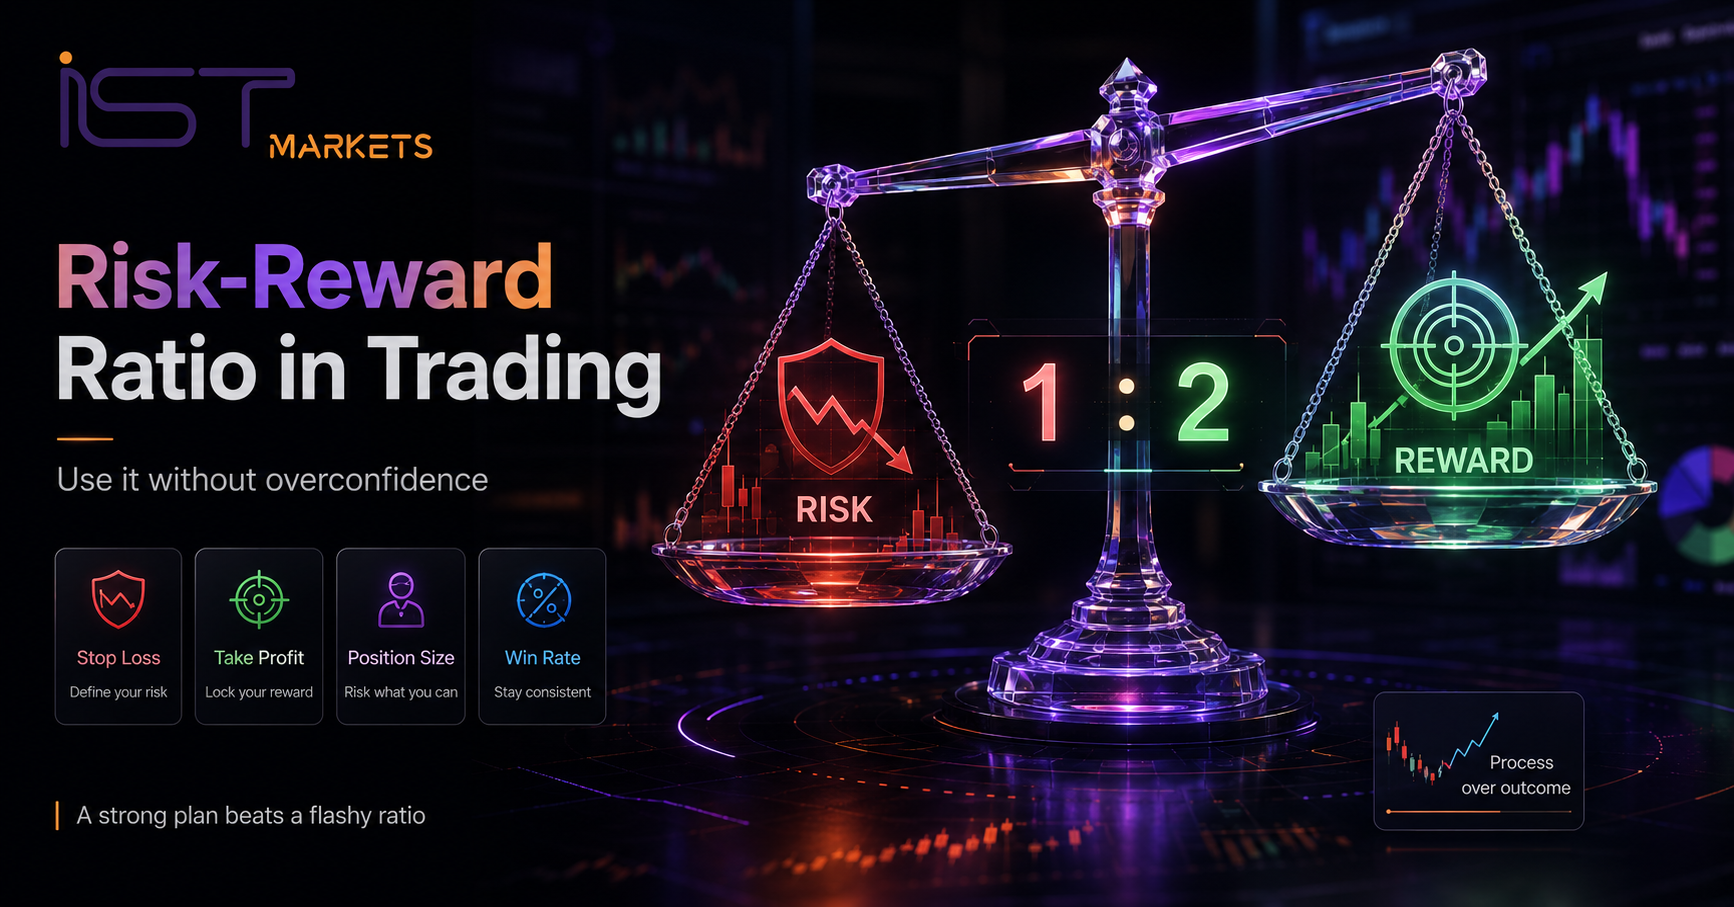
Risk-Reward Ratio in Trading: How Beginners Can Use It Without Overconfidence
A realistic beginner guide to using 1:2 and 1:3 trade plans carefully, without treating a clean ratio as proof of profit, accuracy or trading edge.
Quick Answer: What is risk reward ratio trading?
Risk reward ratio trading compares the amount a trader plans to risk if a trade is wrong with the potential reward if the trade reaches its target. For example, risking $50 to target $100 is often described as a 1:2 risk-reward ratio. The ratio is useful for planning, but it does not guarantee profit, prove edge or make a setup safe. Beginners should also check stop loss quality, take profit realism, win rate, costs, slippage, position size, margin and the full trade plan before using live funds.
This guide treats risk-reward ratio as a planning tool, not a profit promise. The goal is to help beginners read 1:2 and 1:3 setups realistically, while understanding the role of win rate, expectancy, costs, execution and discipline.
This guide uses IST Markets Risk Disclosure, IST pip value and fees education, official retail-forex risk disclosure context, ESMA investor-protection context for CFDs, and established educational trading references for risk-reward definition and formula validation. Examples are simplified for learning and should be checked against live platform specifications, account terms and product conditions.
Content Table
1What risk-reward meansPlanning reward vs risk.
2Reality Check SystemSix questions before trusting a ratio.
3Ratio vs edgeA good number is not enough.
4FormulaHow the ratio is calculated.
51:1 vs 1:2 vs 1:3Meaning and warnings.
6Win rate & expectancyWhy ratio alone is incomplete.
7Beginner scenario1:3 weak plan vs 1:1.5 stronger plan.
8Ratio quality tableWeak ratio vs stronger planning.
What risk reward ratio trading means in real trading terms
Risk reward ratio trading means comparing the planned loss of a trade with the planned reward. If a trader risks $50 to target $100, the risk-reward ratio is commonly described as 1:2. If the trader risks $50 to target $150, the ratio is 1:3.
The ratio is useful because it forces a trader to think about risk before focusing on the possible reward. It can help answer two practical questions: “If this trade is wrong, how much could I lose?” and “If this trade reaches the target, is the planned reward reasonable compared with the planned risk?”
This distinction matters. A chart can show a neat 1:3 target, but that does not mean the target is realistic, the stop loss is well placed, the win rate supports the plan, or the trade can survive live trading costs.
The Risk-Reward Reality Check System
Many beginners do not lose because they misunderstand the ratio. They lose because they trust the ratio without checking the trade behind it. Before trusting a 1:2 or 1:3 setup, run it through this six-part reality check.
| Reality check | Question to ask | Why it matters |
|---|---|---|
| Stop Check | Is the stop loss placed where the trade idea is invalidated? | A stop that is too tight may improve the ratio on paper but fail in normal volatility. |
| Target Check | Is the take profit realistic? | A far target can make the ratio look attractive while being unlikely to be reached. |
| Win-Rate Check | Does the strategy have enough consistency to support the ratio? | A high reward target still needs enough winning trades over time. |
| Cost Check | Could spread, slippage, swaps or commissions reduce the real result? | The visible ratio may be cleaner than the live outcome. |
| Size Check | Does the position size make the money risk acceptable for the account? | A good ratio does not prevent an oversized trade from damaging an account. |
| Execution Check | Could fast markets, gaps or volatility affect execution? | Stops and targets support planning, but execution can differ in live markets. |
A good ratio is not the same as trading edge
A clean ratio can hide weak assumptions. A trader may have a 1:3 plan, but if the stop is arbitrary, the target is unrealistic, the setup has no repeatable logic and costs are ignored, the number is not enough.
A ratio describes the plan. Edge depends on how that plan performs repeatedly after costs, execution differences and trader behaviour.
| A good-looking ratio shows | Real edge also needs |
|---|---|
| Planned risk and target. | Repeatable setup logic. |
| Attractive reward distance. | Realistic target behaviour. |
| Small planned risk on the chart. | Proper position sizing and pip value awareness. |
| A clean number before entry. | Cost, slippage and execution awareness. |
| A structured plan on paper. | Win rate, discipline and review over many trades. |
Official risk context: why ratio planning must stay realistic
Risk-reward planning assumes that the stop loss and take profit behave close to the plan. In live markets, that may not happen. IST Markets’ Risk Disclosure explains risks including leveraged losses, margin calls, stop-loss limitations, slippage, gaps and market disruption.
Official investor-risk sources also treat retail forex and CFD-style products carefully. U.S. retail forex rules include formal risk disclosure requirements, while ESMA’s CFD product intervention framework includes investor-protection topics such as leverage limits, margin close-out, negative balance protection and mandatory risk warnings. These references are used as risk-education context, not as personal legal guidance or a claim that the same rules apply to every reader.
Risk-reward ratio formula explained simply
The basic formula is simple. The real skill is checking whether the stop, target, costs and trade size make sense together.
If planned risk is $50 and planned reward is $100, the ratio is 1:2. This is simplified and does not include spread, slippage, swaps, commissions, conversion, gaps or platform/product-specific conditions.
In price terms, planned risk is often the distance between entry and stop loss. Planned reward is often the distance between entry and take profit. In account terms, traders also need pip value and position size. A 30-pip stop can be small, moderate or large depending on trade volume.
1:1 vs 1:2 vs 1:3 risk-reward ratio comparison
The table below explains common ratios. It is not a ranking from bad to good. A higher ratio can be useful, but only when the target and stop loss are realistic.
| Ratio | Simple meaning | Beginner warning |
|---|---|---|
| 1:1 | Planned reward equals planned risk. | Costs and win rate matter heavily. |
| 1:2 | Planned reward is twice the planned risk. | Still can lose if win rate, execution or target quality are weak. |
| 1:3 | Planned reward is three times the planned risk. | The target may be unrealistic or the stop may be too tight. |
| 2:1 | Planned risk is larger than planned reward. | Can be dangerous if used without a strong, tested plan. |
Risk-reward ratio, win rate and expectancy
Risk-reward ratio alone is incomplete because it does not show how often the plan works. Expectancy asks a more useful question: after many trades, do the average winner, average loser and win rate make sense together?
This is an educational framework, not a guarantee of future performance. Real results can differ because of costs, slippage, gaps, behaviour and changing market conditions.
| Ratio | Break-even win rate before costs | Important limitation |
|---|---|---|
| 1:1 | 50% | Costs mean the real break-even point may be higher. |
| 1:2 | 33.3% | A trader still needs enough winning trades and realistic targets. |
| 1:3 | 25% | Low win rate may be psychologically difficult and target quality matters. |
These break-even figures are simplified and before costs. A trader can look profitable on paper before costs and still perform poorly after spread, slippage, swaps, commissions, conversion, execution differences and emotional mistakes.
Costs, slippage and stop-loss limitations
A risk-reward ratio can look clean before the trade is opened. Live trading can be less clean. Spread can increase the cost of entry. Slippage can change the execution price. Swaps and commissions can reduce the net outcome. Currency conversion can also affect the account result.
Stop-loss and take-profit orders can support planning, but they do not make the plan certain. During fast-moving markets, low liquidity, gaps or platform disruptions, execution may differ from the planned level.
Beginner scenario: 1:3 weak plan vs 1:1.5 stronger plan
Imagine a beginner sees two trade ideas. The first shows a 1:3 ratio. The second shows only 1:1.5. Many beginners would immediately prefer the 1:3 setup. But the better plan is not always the plan with the bigger ratio.
| Plan | Ratio | What looks attractive? | Reality check |
|---|---|---|---|
| Plan A | 1:3 | Large planned reward. | Stop is too tight, target is far away, costs ignored, and win rate is unknown. |
| Plan B | 1:1.5 | Smaller planned reward. | Stop is based on invalidation, target is realistic, costs are considered, and position size is controlled. |
The lesson is simple: the higher ratio is not always the better plan. The goal is not to find the biggest ratio. The goal is to build a plan where the stop, target, position size, costs and win rate make sense together.
Ratio quality table: weak ratio vs stronger planning
A ratio is only as reliable as the assumptions behind it. Use this table to judge the quality of the plan, not just the size of the number.
| Question | Weak ratio | Stronger planning |
|---|---|---|
| Stop loss | Placed close only to improve the ratio. | Placed where the trade idea is invalidated. |
| Take profit | Chosen far away randomly. | Based on structure, volatility or strategy logic. |
| Costs | Ignored. | Included before judging the plan. |
| Win rate | Unknown or assumed. | Reviewed with strategy history or demo practice. |
| Position size | Ignored because the chart ratio looks good. | Connected to account equity, pip value and planned risk. |
Risk-reward ratio vs position sizing, lot size and pip value
Risk-reward ratio answers one question: how does the planned reward compare with the planned risk? It does not answer every risk question. A complete trade plan also needs position sizing, pip value and cost awareness.
| Concept | Main question | Why it matters |
|---|---|---|
| Risk-reward ratio | What is the planned reward compared with planned risk? | It structures the trade plan. |
| Position sizing | How much account money is exposed? | It connects stop distance to account equity. |
| Lot size | What trade volume is being used? | It changes pip value and account impact. |
| Pip value | How much is each pip worth? | It translates chart distance into money impact. |
Common risk-reward ratio mistakes beginners should avoid
| Mistake | Why it is risky | Better approach |
|---|---|---|
| Treating 1:2 or 1:3 as a guarantee | The ratio does not prove edge or execution quality. | Use the ratio as one planning input only. |
| Moving the stop loss after entry | It destroys the original risk plan. | Define invalidation before opening the trade. |
| Choosing unrealistic take-profit targets | A far target may make the ratio look good but rarely get reached. | Base targets on structure, volatility and strategy logic. |
| Ignoring win rate | A high ratio can still fail if winners are too rare. | Review ratio with win rate and expectancy. |
| Ignoring costs | Spread, slippage, swaps and commissions can reduce net reward. | Check costs before using live funds. |
| Making stops tight just to improve ratio | Normal volatility can hit the stop before the setup has time to develop. | Place stops based on trade invalidation, not cosmetic ratios. |
| Treating demo results as proof | Demo does not fully recreate live pressure and execution risk. | Use demo to practise the process, not to prove future performance. |
Risk reward ratio trading checklist before taking action
Use this checklist before relying on a risk-reward ratio in a live trade. If several answers are unclear, the ratio may not be ready for live execution.
| Readiness question | Ready? | Why it matters |
|---|---|---|
| My stop loss has a clear trade reason. | Yes / No | A stop should reflect invalidation, not only ratio design. |
| My take profit is realistic. | Yes / No | A distant target can make the ratio look better than the plan. |
| I know the money risk, not only the pip distance. | Yes / No | Pip value and position size change account impact. |
| I have considered win rate or strategy history. | Yes / No | Ratio alone does not show expectancy. |
| I checked spread, slippage, swaps and commissions. | Yes / No | Costs can change the real outcome. |
| I reviewed risk documents and account terms. | Yes / No | Platform access does not remove trading risk. |
| I practised the process before using real funds. | Yes / No | Practice supports discipline, but does not prove future live results. |
What to do after reading this
The next step is not to search for the “best” ratio. The next step is to build a process you can repeat carefully.
- Choose a practice setup, not a live trade.
- Define the stop loss and why the trade would be wrong there.
- Define the take profit and why the target is realistic.
- Calculate the risk-reward ratio.
- Translate the stop distance into money risk using pip value.
- Review costs, margin and execution risks.
- Practise the routine before moving to live funds.
Risk reminder before the CTA
Before using live funds, review the risk disclosure, legal documents, account terms, trading fees and platform conditions. A risk-reward ratio can help plan a trade, but it cannot guarantee stop-loss fill, target execution, market direction, account outcome or the suitability of leveraged trading for every person.
A responsible trader does not use a ratio as proof. The better approach is to use it as one part of a wider trade plan that includes stop quality, take-profit logic, position sizing, costs, win rate and discipline.
Soft CTA: Practise your risk-reward process before using live funds
Before placing live trades, review the IST Markets risk disclosure, check the legal documents, practise through a demo account, compare account types, and review trading fees and costs.
Practise first. Verify first. Treat risk-reward ratio as a planning tool, not a profit signal.
The goal is not to find the biggest ratio. The goal is to build a plan where the stop loss, take profit, position size, costs, win rate and execution risks make sense together.
FAQ
What is risk reward ratio trading in simple terms?
Risk reward ratio trading compares the amount a trader plans to risk with the planned reward if the trade reaches its target. It helps structure a trade plan, but it does not guarantee profit.
How does risk reward ratio trading work for beginners?
A beginner identifies the planned stop loss and take profit, then compares the planned loss with the planned reward. The ratio should also be checked against win rate, costs, execution risk and position size.
Is a 1:2 risk-reward ratio always good?
No. A 1:2 ratio can help structure a plan, but it is not automatically good. The trade still needs a realistic stop loss, realistic target, suitable position size, cost awareness and a strategy that can support the ratio.
What is the difference between risk-reward ratio and win rate?
Risk-reward ratio compares planned reward with planned risk. Win rate shows how often trades win. A strategy needs both context because a high ratio can still fail if the win rate is too low or costs are too high.
Can a good risk-reward ratio still lose money?
Yes. A good-looking ratio can still lose if the trade setup fails, the target is unrealistic, the stop is too tight, costs reduce the result, slippage occurs, or the strategy does not have enough winning trades over time.
What should beginners check before using risk-reward ratio?
Beginners should check stop loss logic, take-profit realism, pip value, position size, win rate, spread, slippage, swaps, commissions, margin impact, account terms and risk disclosure before using live funds.
What mistakes should beginners avoid with risk reward ratio trading?
Beginners should avoid treating ratios as guarantees, setting unrealistic targets, placing stops too close, ignoring costs, moving stops after entry, ignoring win rate and treating demo results as proof of live performance.
References & Further Reading
- IST Markets Risk Disclosure
- IST Markets Legal Documents
- IST Markets Demo Trading Account
- IST Markets Demo vs Live Account
- IST Markets Trading Account Types
- IST Markets Trading Fees and Costs
- IST Markets Pip Value Calculator Explained
- BabyPips Forexpedia — Risk-Reward Ratio
- CFTC — Foreign Currency Trading
- eCFR — 17 CFR § 5.5 Risk Disclosure Statement
- ESMA — CFD Product Intervention Obligations